
1. What is Retriever?
Retriever is an open-source, self-hosted observability service that puts valuable telemetry data in the hands of small teams. If you're running your application in AWS, Retriever can be ready to collect and display data in a few minutes. AI agents can use the Retriever MCP server to query and analyze data, so that you can diagnose and solve problems without having to alt-tab out of your IDE.
2. Modern Observability
2.1 What is Observability?
Observability, at its heart, is about the ability to understand the state of your application, now and in the past. With observability, an engineering team can, for example, see how that spike in site traffic is pushing the p95 response time from 200ms to 1.5 seconds. An observable application is one that lets us see that, say, memory usage on a particular service is steadily climbing toward its limit.
Observability is critical when, inevitably, something goes sideways in production and all heads turn toward the engineering team until the problem is identified and fixed.
Traditionally, teams relied on logging application output to the console to understand what was happening. The problem with unstructured logs is that there is no direct link between a log and its corresponding request, or to a specific, say, spike in 500 errors. Modern observability addresses this with multiple signals: metrics to spot anomalies, traces to follow requests across services, and logs to capture the details. Together, this telemetry data turns "something is broken" into "this specific database query in the purchase order service is timing out."
2.2 Observability Applied
The first step in building an observable system is instrumentation, where developers write code within their application to send telemetry data to a central location. Once the application is instrumented, it sends its telemetry to a collector, an application designed to format and filter telemetry. The industry standard is OpenTelemetry, which defines both instrumentation SDKs and a protocol (OTLP) for transmitting telemetry.
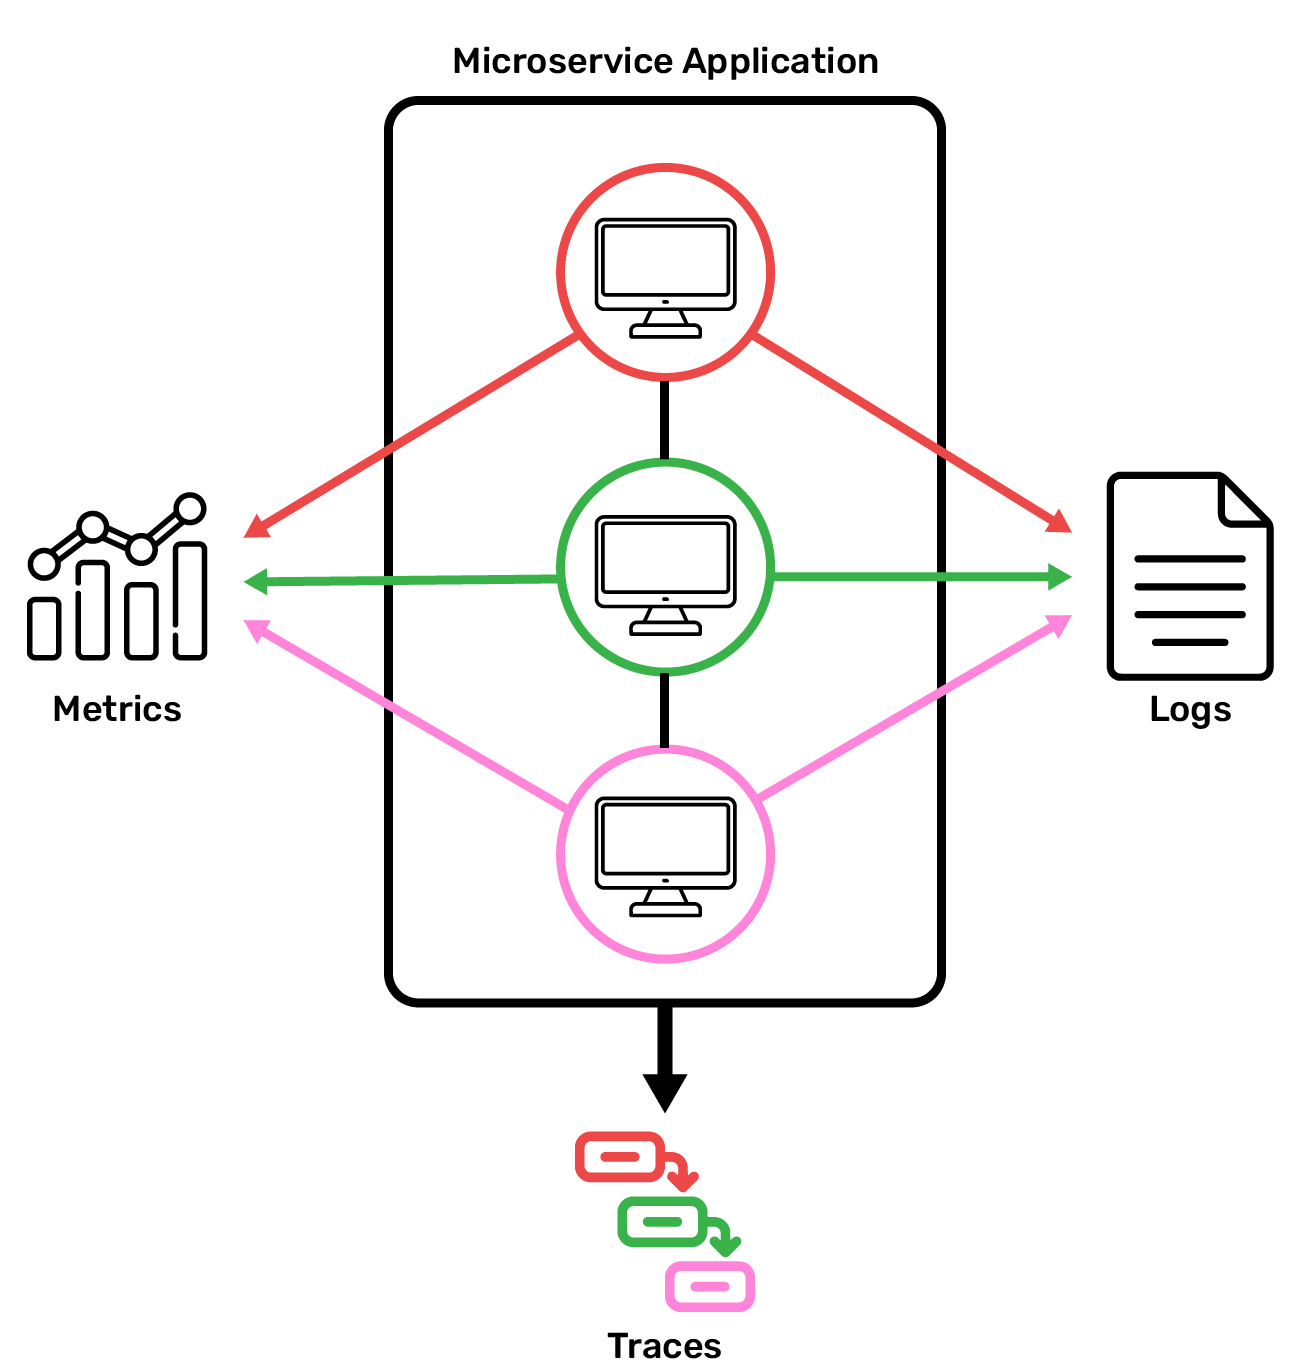
Once we're collecting data, we need a place to store it. Telemetry data has specialized storage requirements: new data is written to the database frequently and continuously, old data never needs to be updated, and very large volumes of data can accumulate over time. Specialized databases are needed to meet these requirements; we discuss some of the options for trace storage in section 5.2.
Now that all that telemetry is stored for querying when something goes awry, we need a way to visualize the telemetry--turning it from large JSON blobs into something that's easy to visually parse--so that we can easily use the telemetry to trace the issue to its source.
In practice, this workflow typically starts with an alert: for instance, a Slack message triggered when a service's error rate spikes. The alert directs engineers to a visualizer where they can dig into the telemetry. That way, engineers can focus on their current sprint, and only need to divert their attention to their observability tools when a problem arises.
2.3 Why Trace-First Telemetry?
Metrics and logs each play an important role in telemetry. Metrics are excellent for aggregating data points, like CPU utilization, over time, which helps engineers identify anomalies in the production environment. But a metric tells you that something is wrong, not where; when an error rate spikes, without other context, metrics generally can't pinpoint the culprit service. Meanwhile, logs usefully capture detailed, human-readable information about individual events. That said, correlating individual logs to reconstruct a single request's path can be a tedious task even in a monolithic architecture.
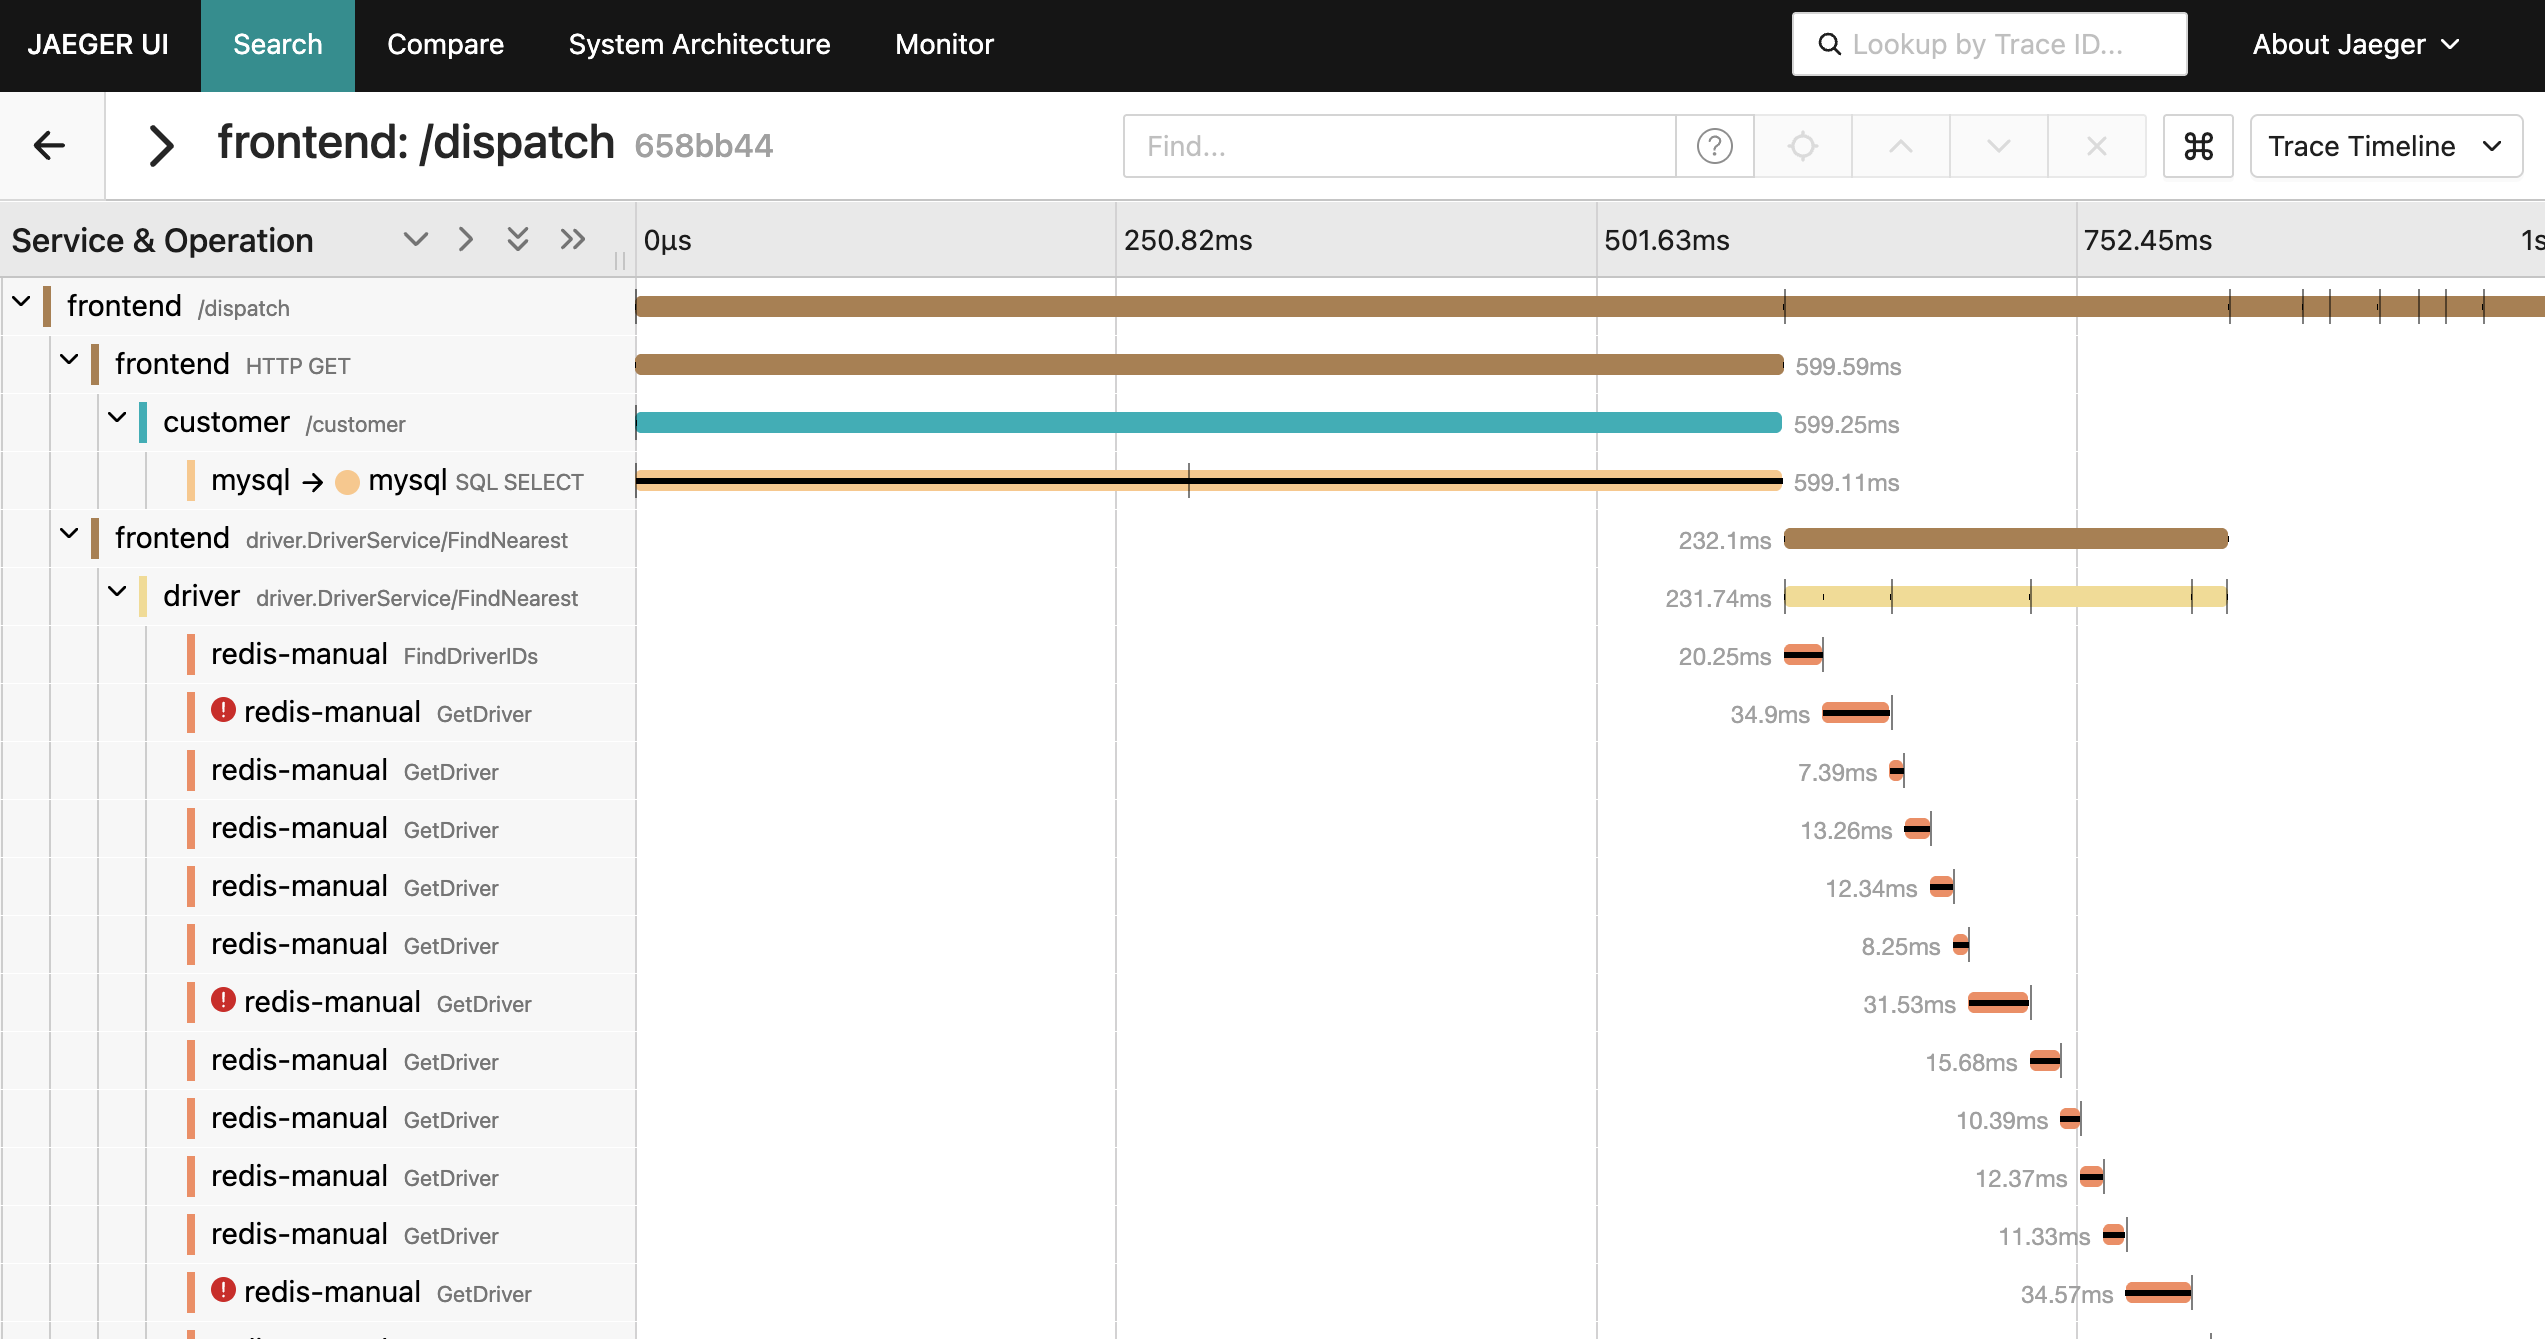
Given the complexity of modern applications, traces emerged to address the observability challenges introduced by distributed systems; they stitch together all the sub-requests associated with a single incoming request so that developers can understand every step in the lifecycle of a request as it hops from service to service. A single trace is made of multiple spans, with the first span representing the root span and underlying spans representing a process that occurs during the parent request. Traces capture the complete journey of a request as it flows through multiple services, and therefore allow for powerful root cause analysis across a distributed system – but finding the relevant trace among thousands still requires manual investigation. This is where AI agents can help—if they can access the trace data.
2.4 Agentic AI in Observability
A modern approach to observability integrates AI agents. Utilizing AI to debug in production previously required iterations of combing through recent telemetry data and reasoning about which data was important context, then copy/pasting it into a chat with the agent, followed by iterations of narrowing or widening the context to eventually figure out the root cause. Finally, the bug fix is written and the solution pushed to prod.
Ideally, teams want to give the agent the ability to query trace data directly, so that it can perform root cause analysis side-by-side with the developer. This functionality was previously unlocked by writing a custom integration for an LLM client to query the trace store. The tradeoff to writing a custom integration is that if a team switches models (say, from Anthropic to Open AI) or clients (Cursor to Claude Code), a new integration would be needed--new authentication handling, new API wrappers, new response parsing--which could lead to endless cycles of integration writing and maintaining.
The Model Context Protocol (MCP), has become widely adopted in 2025, largely because it cures the headaches around integrating each client individually. MCP is a standardized, model-agnostic protocol to enable new functionality in AI clients: an MCP server exposes callable functions (tools), the host (e.g., Cursor) can invoke those tools, and the LLM receives the results. For observability specifically, this means an MCP server can expose tools to Cursor that enable it to query the trace data store or recent metrics. From there, it can iterate on its own to perform root cause analysis.
It's worth noting one challenge for AI in observability applications: telemetry is generally verbose, by design, to give a large amount of context to human engineers who are making sense of the system. This verbosity presents a challenge for MCP-based debugging tools: telemetry data has been known to 'blow up the context window' when debugging with an agent. We describe a few approaches to addressing this challenge in section 5.7.
3. Existing Observability Solutions
3.1 Commercial SaaS Platforms
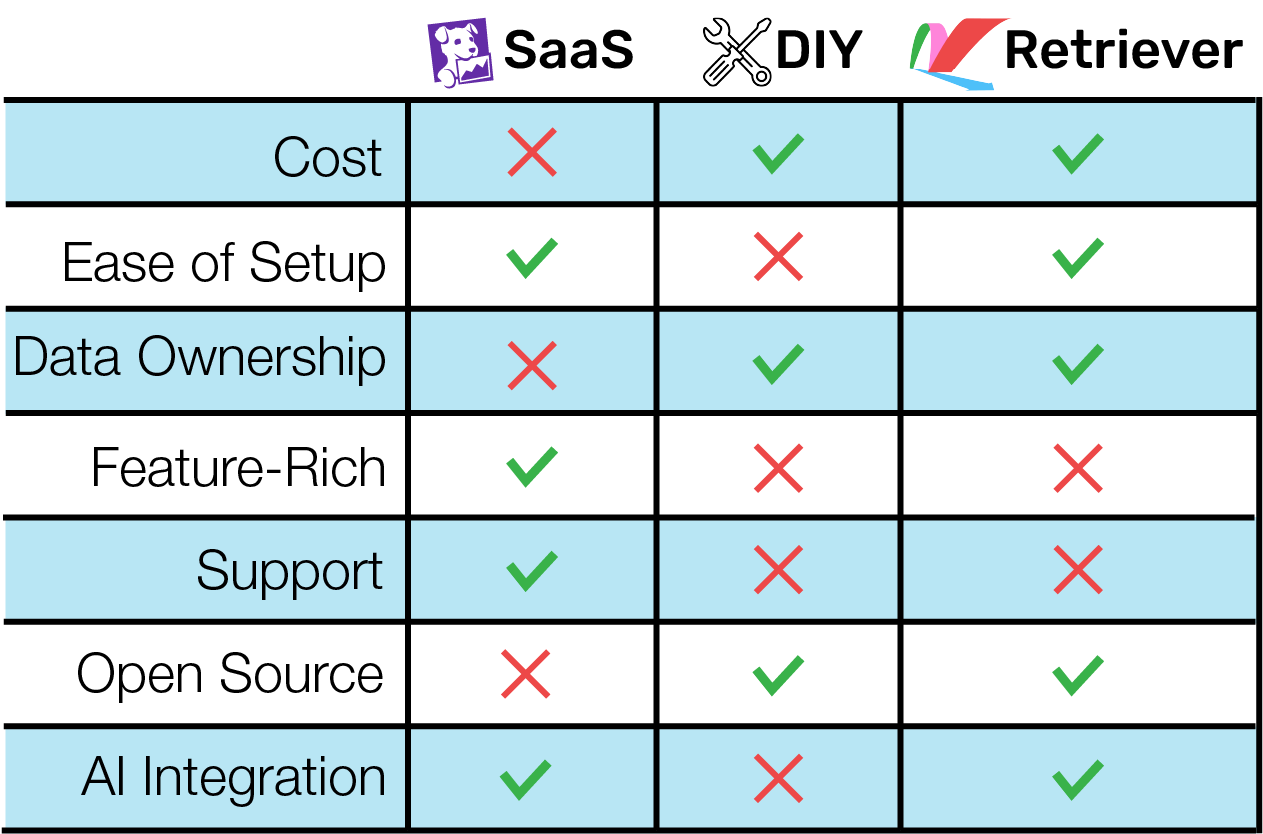
Platforms like Datadog and Honeycomb allow teams to abstract away the complexity of observability. The user takes responsibility for instrumenting their app, and the platform handles everything else. These enterprise solutions generally offer (or are developing) MCP integration for AI-assisted debugging.
These services are feature-rich and easy to use, but they aren't cheap. Users might be surprised to find their observability bill eating up a significant chunk of their budget. Costs can also explode unpredictably based on innocuous-looking instrumentation choices, like sending high-cardinality metric data.
Even if Datadog were free, it might not be every team's first choice. Users cede ownership of their telemetry data to the platform provider. They may have little or no control over how much of their data the provider retains, or for how long, and choosing to change providers generally means leaving behind historical data.
3.2 Self-Hosted Open-Source Tools
If you don't want to buy your observability, you can always build it. There are many open-source solutions out there, from full-featured suites like the Grafana stack to cutting-edge high-performance tools like Quickwit.
These don't cost money, but they can cost significant engineer time. Setting up and maintaining observability services gets complicated quickly; a full-fledged observability stack is its own microservice architecture, with all the needs that implies. Adding an MCP only increases the burden: some open source options have them, but some details, like authentication, are left to the user to figure out. Time spent building your observability stack is time that could be spent building valuable product features.
4. Retriever's Solution
4.1 What Retriever Offers
Running the Retriever command-line tool will spin up a complete observability platform in AWS, ready to accept, store, and display telemetry data.
Retriever is focused on trace data and does not accept traditional logs or metrics. Instead, users can instrument their application to emit log data in the form of span events embedded within traces. Retriever also derives metrics, such as error rates, from the trace data it receives. Users can configure alerts based on these metrics to be sent to a dedicated Slack channel.
Users can query, filter, and search their trace data in a web dashboard. Their AI agents can do the same via the Retriever MCP server. When the user prompts their Cursor agent to examine telemetry data, the agent can use Cursor's connection to the MCP server to freely query trace data, gathering the evidence it needs to pinpoint problems and suggest fixes.
4.2: The Intended User
We built Retriever for small teams running their applications in AWS. Retriever is for teams that want:
- to pay only the AWS costs associated with Retriever's infrastructure
- to keep their telemetry data in-house, confined to their AWS VPC
- to spend their engineering time on other valuable goals
- to leverage agentic AI in their debugging workflow
Retriever is not a good fit for:
- large organizations that can afford an SaaS provider and want the powerful features these providers offer
- teams that have already built their own observability services
- teams running their applications in other cloud providers, or outside the cloud entirely
4.3: Comparing Retriever with Other Solutions
5. Important Design Decisions / Tradeoffs
5.1: Scoping Our Signals
While the observability field recognizes three primary types of telemetry signals (as a recap - logs, metrics, and traces), it's not a given that a solution should support all three. Each signal must be ingested, stored, and queried in a different way, typically by different services; signals must also be correlated so that users can know, for instance, what logs belong to what traces. The question for us, then, was whether focusing on one or two signals could offer our users a more streamlined experience without sacrificing functionality.
As we researched open-source observability tools, we found ways to work with traces without sacrificing the descriptive power of logs or the high-level digestibility of metrics. By focusing solely on trace data, we were able to simplify our architecture, reduce infrastructure costs, and offer the user a more streamlined experience.
5.2: Choosing A Stack
With traces in mind, we set out to choose the set of components that would form our trace observability system. While it was certainly possible to build our own services to handle collection, storage, querying, and visualization, that wasn't the focus of Retriever. We wanted to draw from the many high-quality open-source options and package them with simple automated deployment and MCP functionality. After discarding some clearly unsuitable options like the ELK stack and GreptimeDB, we were left with two candidates: Grafana and Jaeger.
Grafana
The Grafana stack is an ecosystem of services that handle different telemetry signals, with Grafana itself as the visualization service that pulls all of the telemetry data together. Grafana's draw was flexibility. The dashboard allows users a lot of freedom to customize their UI to their needs. On a project scope level, Grafana would also allow us to expand Retriever to handle the other telemetry signals in the future.
However, Grafana's trace service, Tempo, didn't meet our needs. Early releases of Tempo didn't allow users to query traces at all; they had to find a trace id in a metric or log, then look up that id in Tempo. Tempo has recently added TraceQL for true trace querying, but this is a young feature that is still being updated, and not yet a good foundation for a dedicated trace observability service like Retriever.
Jaeger
Jaeger is an open-source solution purpose-built for trace data. It's mature and widely adopted, but not out of date - in fact, Jaeger v2 was released in late 2024.
The Jaeger dashboard isn't as open-ended as other options like Grafana; you're limited to a few standardized views of your data. However, this isn't necessarily a bad thing. As we test-drove backends, the Jaeger UI stood out as easy and pleasant to use, while still allowing for flexible querying.
As a battle-tested solution with a shared focus on trace data, Jaeger stood out as a natural fit for Retriever.
5.3: Choosing a Data Store
Having settled on Jaeger as our query and UI solution, it was time to choose a storage solution. Jaeger supports several integrations, but many of these were clearly the wrong fit. For instance, Apache Cassandra is a distributed database with incredible scalability, but our target user doesn't operate at a scale that generates the massive volumes of data Cassandra is suited for; a simpler database architecture is better. Clickhouse is an extremely performant column-oriented database, but there isn't yet an official Jaeger integration, and we didn't want to rely on the experimental integration.
Another interesting option was Quickwit, a search engine that's optimized to store data in object storage (like AWS S3) with a high compression rate, and query massive volumes of that data quickly. While not officially integrated with Jaeger, we had the option to use a non-Jaeger telemetry collector (most likely the OpenTelemetry Collector) to gather telemetry data, then use the Jaeger query and UI services to pull data from Quickwit.
However, like a sports car, Quickwit must be tuned carefully to perform at its best. This means setting up your data indexing during Quickwit setup. Without knowing the exact shape of our end user's telemetry data, it wasn't clear what indexes would deliver the best performance. Quickwit is also still in early development (not yet at 1.0.0 at time of writing), meaning we would need to keep up with breaking changes as we built Retriever.
That left us with Elasticsearch and OpenSearch. Elasticsearch is a document database with powerful text search capabilities. It's not as performant as a columnar database like Clickhouse for certain tasks, but at our target user's scale, the difference isn't significant. Like Jaeger, Elasticsearch is a mature solution used throughout the industry.
In the last few years, Elasticsearch switched from open-source to a more ambiguous dual license, and then switched back. This made us hesitant to adopt Elasticsearch, and led us to the open-source fork OpenSearch. We missed Elasticsearch's excellent documentation, but not much else - OpenSearch behaves very similarly and performs comparably. We discuss OpenSearch in more detail here.
5.4: All-In-One vs Separate Jaeger Architecture
Jaeger can be configured to run in an "all-in-one" configuration, where a single Jaeger service handles collecting and querying data, or it can be configured as a separate "collector" service and "query/UI" service. While we prioritized simplicity throughout Retriever's design, we still felt that separating the two services was worth it. Collector traffic will be much higher than query traffic, so the collector should be able to scale out independently as needed. Separating the services also gave us more insight into the behavior of each service in isolation as we built our infrastructure; users maintaining their Retriever services will inherit this ease of monitoring and troubleshooting.
5.5: Deploying Retriever
From the beginning, we planned for Retriever to be a service users would self-host in AWS. Our first big infrastructure decision was: where in AWS? Retriever could deploy in its own VPC, separate from the VPC the user's application was running in. The user would send their telemetry data to some public endpoint provided by Retriever.
There was a lot to like about this strategy. It compartmentalized Retriever from the user's other AWS services. It didn't require that the user have any particular infrastructure set up already. In fact, it didn't require that the user run their application in AWS at all - the application could run anywhere, in a cloud or on-premises, and still use Retriever.
The downside was security. Since telemetry data was traveling over the public internet, it needed to be encrypted and connections needed to be authenticated. The OpenTelemetry standard mandates MTLS (Mutual Transport Layer Security) for this, which the user would need to configure for their own application. Security also adds compute time to every request; since telemetry collection involves a continuous stream of requests, this adds up.
To avoid these problems, we decided to deploy Retriever such that the Jaeger collector ran in the same private subnet as the user's telemetry-emitting service. Here, the telemetry data never leaves the subnet, meaning we don't need to worry about a secure connection. Users need to provide the VPC and subnets, but they don't have to worry about configuring MTLS.
5.6: Orchestrating Containers
Now that we decided where to deploy, we turned to how to deploy. We needed an orchestration solution that was cost-effective and easy to maintain. AWS offers several options, and we evaluated them against these two criteria. We quickly ruled out EKS (Elastic Kubernetes Service). Kubernetes is a useful and powerful way of orchestrating containers in production, but it's overbuilt for Retriever's needs. Retriever only involves a handful of containers, none of which we expect to scale dramatically. Kubernetes' features come at the cost of high operational complexity that, in the long run, our users would inherit.
ECS (Elastic Container Service) offered the simplicity we wanted. The remaining question was whether to run ECS on self-managed EC2 instances or on Fargate, AWS's serverless container platform. EC2 would give users predictable costs tied to provisioned instance capacity, but it shifts maintenance burden (like manually installing security updates) onto them as well. Fargate costs roughly 10-20% more at equivalent compute, but eliminates that operational overhead entirely.
In line with Retriever's focus on user convenience, we opted to use AWS's serverless container offering, Fargate, instead. We expect Fargate to be slightly more expensive, but it makes Retriever much more of a "set and forget" service, with minimal maintenance needs.
5.7: MCP Implementation
We wanted the Retriever MCP to seamlessly and securely integrate into the typical debugging workflow via an agent like Cursor. To give it access to the trace data that enables debugging, we had to integrate with the Jaeger Query API. When determining between the leaner v1 Jaeger Query API, which returns trace data that is 4x smaller, or the better-documented v3, which returns larger, data-rich traces, we went with v3, prioritizing better support and traces that are structured to align fully with the OTLP.
Tool Count vs Tool Flexibility
We started by developing many single-purpose tools for our MCP (e.g. `get_error_traces`, 'get_recent_traces`, `compare_traces`, etc). While the purpose of each tool was clear and their development was straightforward, we found that the "LLM overhead" associated with exposing so many tools to the model was too high. Each tool exposure increases context window consumption, and has to be held "in memory" by the model throughout the conversation, increasing the chance of incorrect tool selection and unnecessary back-and-forth.
We found that building just a few highly customizable tools, like `get_traces`, which has the ability to query for one or more traces that match many criteria, allowed for fewer tool calls during debugging; one tool call for "traces from 'checkout' with error codes in the last 5 minutes" instead of chaining together 3 or 4 calls of single-purpose tools for the same information.
Selective Context Extraction
Reducing tool count was only part of the optimization — we also had to minimize the data returned by each tool call. A common challenge when working with LLMs is efficiently managing the context window: giving the model the useful data it needs to do root cause analysis while not blowing up the context window and bringing the chat to an abrupt halt. In our testing, a typical span from the v3 API was approximately 2.5kb, or ~800 tokens. A single request that touches, say, 5 or 6 services has a trace as large as 4000 tokens. Our MCP distills the Jaeger API response to about 500 tokens, more than an 85% reduction in tokens, significantly optimizing interactions with an LLM.
Prior to forwarding Jaeger's response to the LLM, our server builds a trace summary optimized for debugging, keeping only a handful of attributes, like traceId, operation, and status, plus error details and relevant tags. That means we drop token-heavy data like internal instrumentation metadata, unrelated trace flags, resource attributes beyond service name. Similarly, the MCP condenses 8 separate Prometheus API responses into a single unified object that compares the returned metrics to given thresholds to illustrate the health of the system.
Time Hallucinations
When querying Jaeger, the v3 API requires `start_time` and `end_time` parameters. Just like a human would determine the appropriate arguments for a tool call, the model is responsible for providing values when a user prompts, for example, "find any traces with a 500 status in the last 15 minutes." However, models consistently struggled to produce accurate timestamps, even with hard-coding the current time.
We realized that, while models are very capable at identifying reasonable values for other arguments, we had to engineer a tool interface that addressed this particular time-oriented weakness of LLMs. So we wrote the tool to expect a `look_back` parameter (an idea we took from the v1 API), which models were able to use more effectively, and our server translates the lookback argument (e.g. 10 min) into the appropriate time arguments (the current time minus the lookback duration).
5.8: Securing Retriever:
Security is an issue for any application, but even moreso for an application that holds potentially sensitive telemetry data. We needed to make sure our public-facing endpoints were secure without overcomplicating the user experience.
The first endpoint we considered was the MCP server: users needed a streamlined way to authenticate their clients. We initially planned on using OAuth2.0 as an established, secure, user-friendly means of providing access. There was a simpler option, however: provide a JWT (JSON Web Token) directly from the Retriever CLI. Retriever would hold the JWT secret in AWS Secrets Manager, and could mint tokens as needed as long as the requesting user was authenticated in AWS. From there, the user could copy the freshly generated token to their MCP configuration file. This constrained access in the same way OAuth2.0 would, but in a way that was simpler for users.
Having decided on this "direct JWT delivery" approach for the MCP, it was time to think about user-facing services. Jaeger doesn't provide any authentication support, while Prometheus supports a rudimentary basic auth strategy. In our target use case, it wouldn't make sense for individual users to have differing permissions; therefore, we wanted all user-facing services to authenticate the same way, using the same data for a given user.
We first considered Cognito, the de facto AWS user authentication service. As we continued to develop the MCP authentication infrastructure, though, we started to wonder if we could use the same JWT-only workflow for user authentication. Again, we didn't need different levels of permissions per user; any user with a valid JWT for their MCP client should also have access to Jaeger and Prometheus. This would let us avoid some of the infrastructure overhead associated with Cognito, such as creating user pools. It also tied security to a single reference point, the JWT secret; in the event of a security issue, the secret only needed to be regenerated once in Secrets Manager to invalidate all old JWTs. We built a proxy server, discussed below, to handle this JWT-based user authentication strategy.
6. Architecture
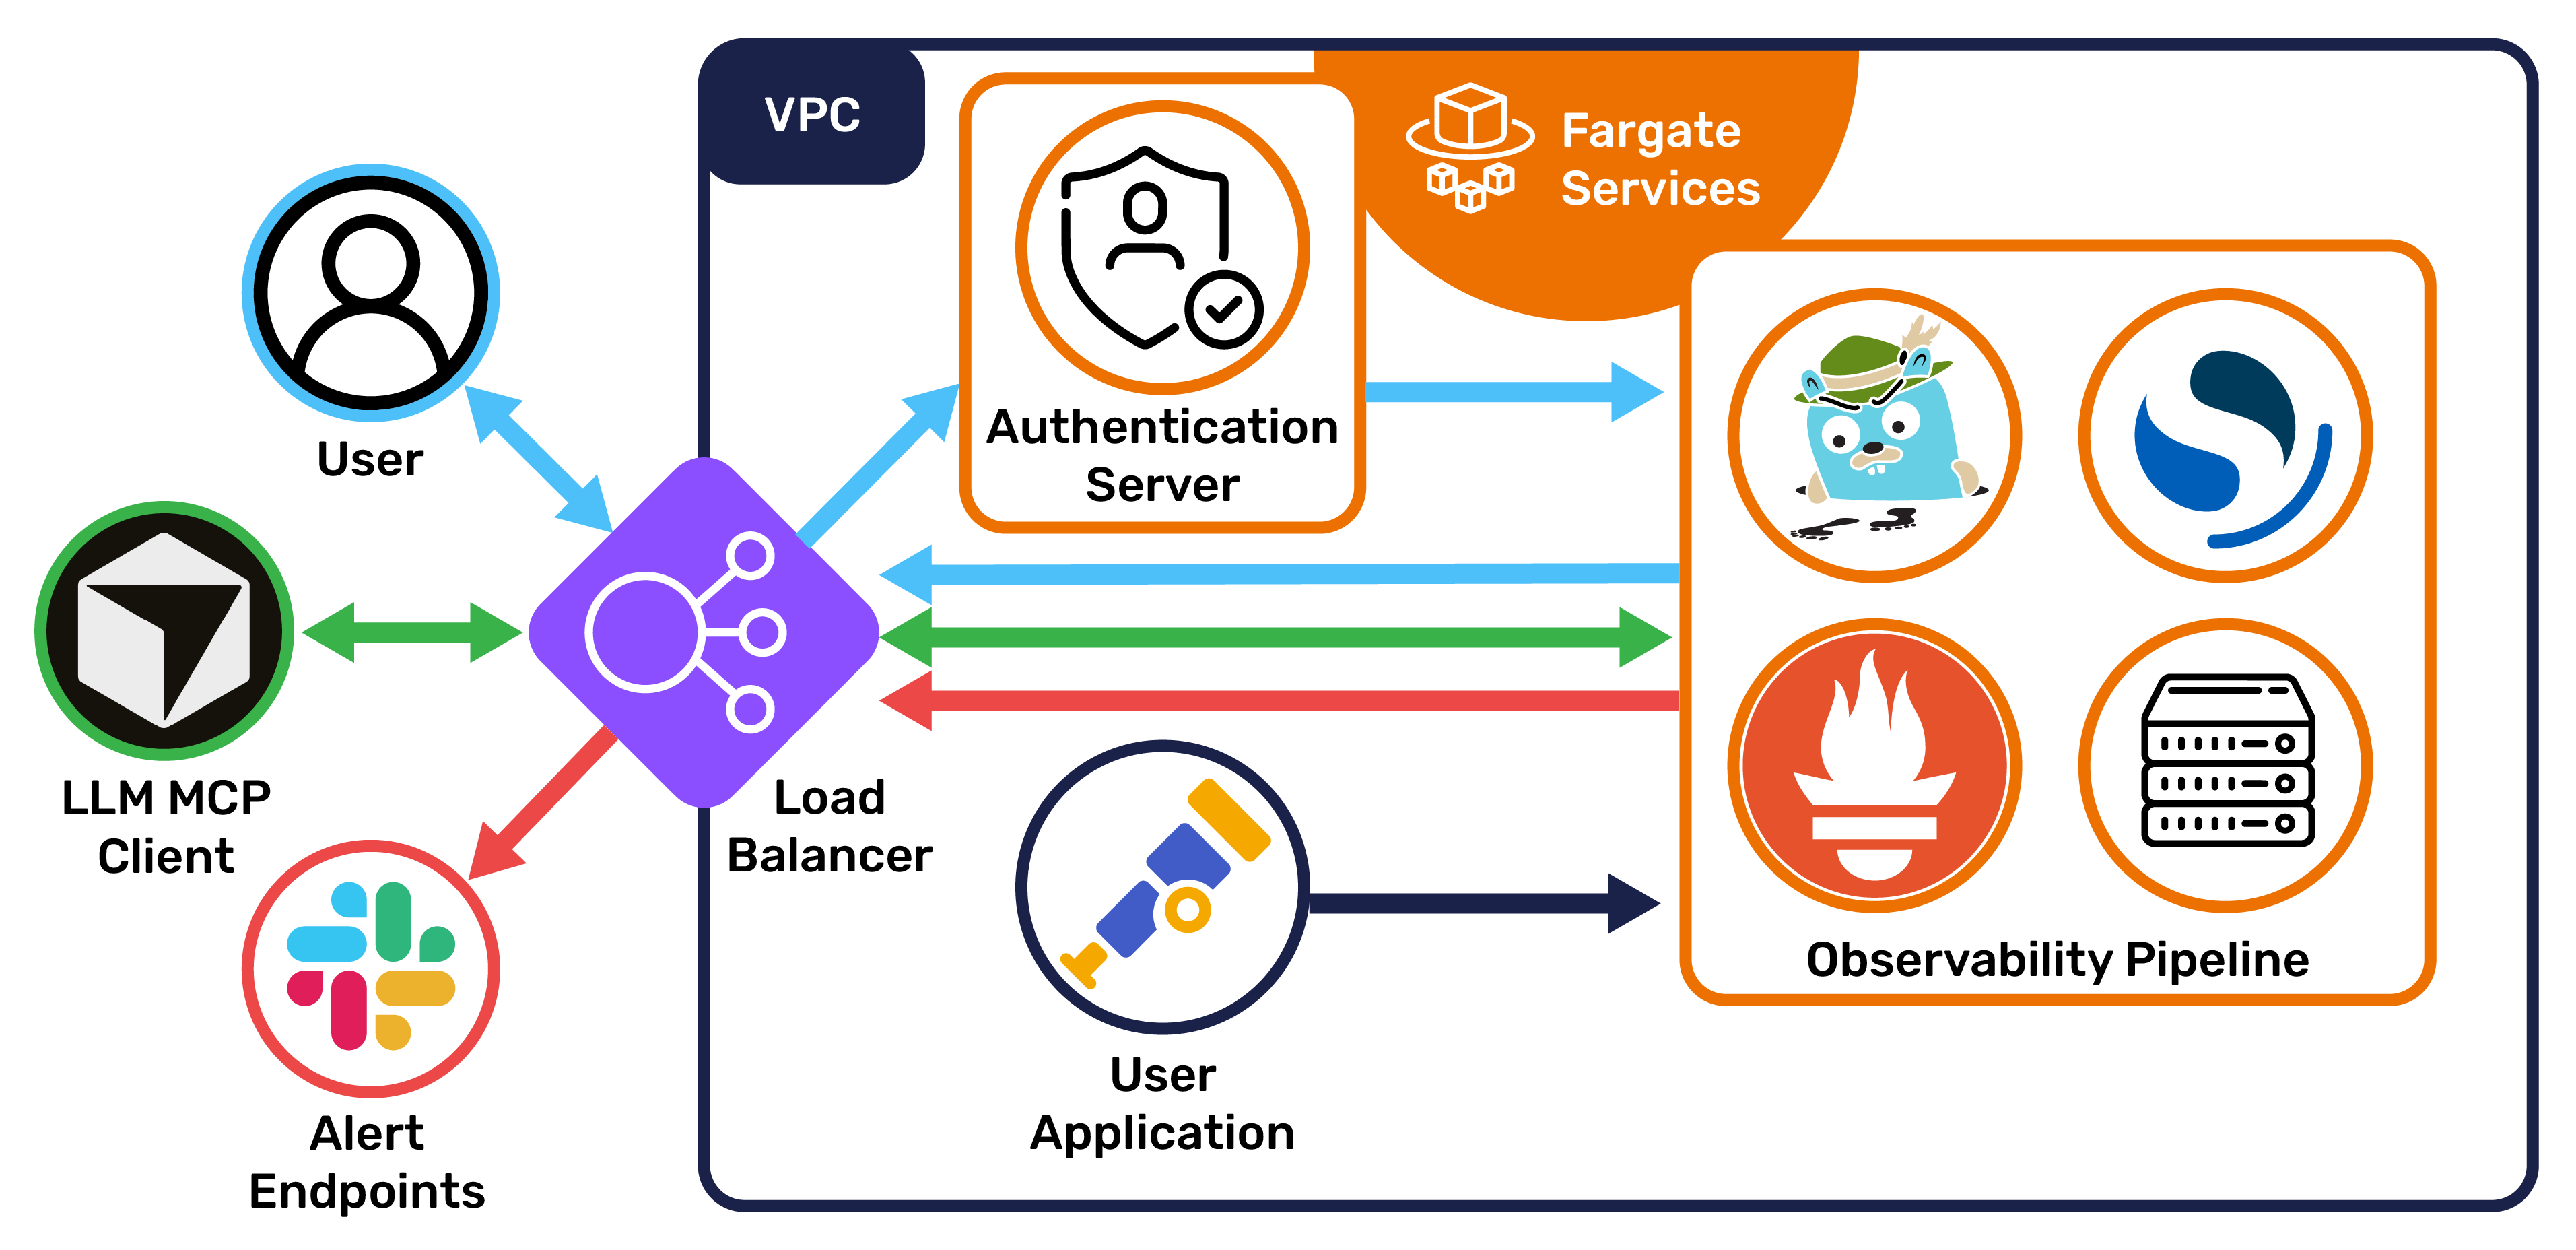
When a user runs the setup process in the CLI, Retriever uses Terraform to provision its infrastructure and start running its services:
6.1 Jaeger Collector:
The Jaeger Collector is the endpoint for the user's trace data. As spans arrive, the Collector derives aggregated spanmetrics that record request counts, error rates, and request durations (RED metrics). Rather than sending each span directly to OpenSearch, the Collector sends data in periodic batches to reduce network traffic. The spanmetrics are exposed on a port to be scraped by Prometheus.
6.2: OpenSearch
OpenSearch stores trace data, writing new data in bulk as it receives each batch from the Collector. Each span is stored as its own document.
When it's time to query this data, OpenSearch uses inverted indices to quickly find the desired traces and spans. Indices are partitioned by day; because traces are naturally grouped by time and queries typically focus on recent data, this partitioning strategy doesn't slow down querying.


6.3: Prometheus and AlertManager
Prometheus stores metric data, scraping spanmetrics from the Jaeger Collector at short intervals, and takes responsibility for alerting. In Retriever, Prometheus is configured to fire alerts based on general heuristics, such as a service that returns an error more than 5% of the time. These alerts are sent to AlertManager, which in turn delivers them to a user-specified endpoint.
Because spanmetrics are RED metrics derived from span data, they resemble SLOs (service-level objectives) more than traditional metrics like CPU usage. Spanmetric-based alerts reflect problems in the consumer experience of your application.
6.4: Jaeger Query and UI
Jaeger Query acts as a bridge between the trace storage and anything that needs the trace data; it provides a RESTful API for the UI and MCP.
The Jaeger UI runs as part of the query service. Users can access the dashboard over the public internet via a load balancer. From there, they can search and filter to find the data they want, examine individual traces and spans in detail, and view spanmetrics pulled from Prometheus,
6.5: MCP Server
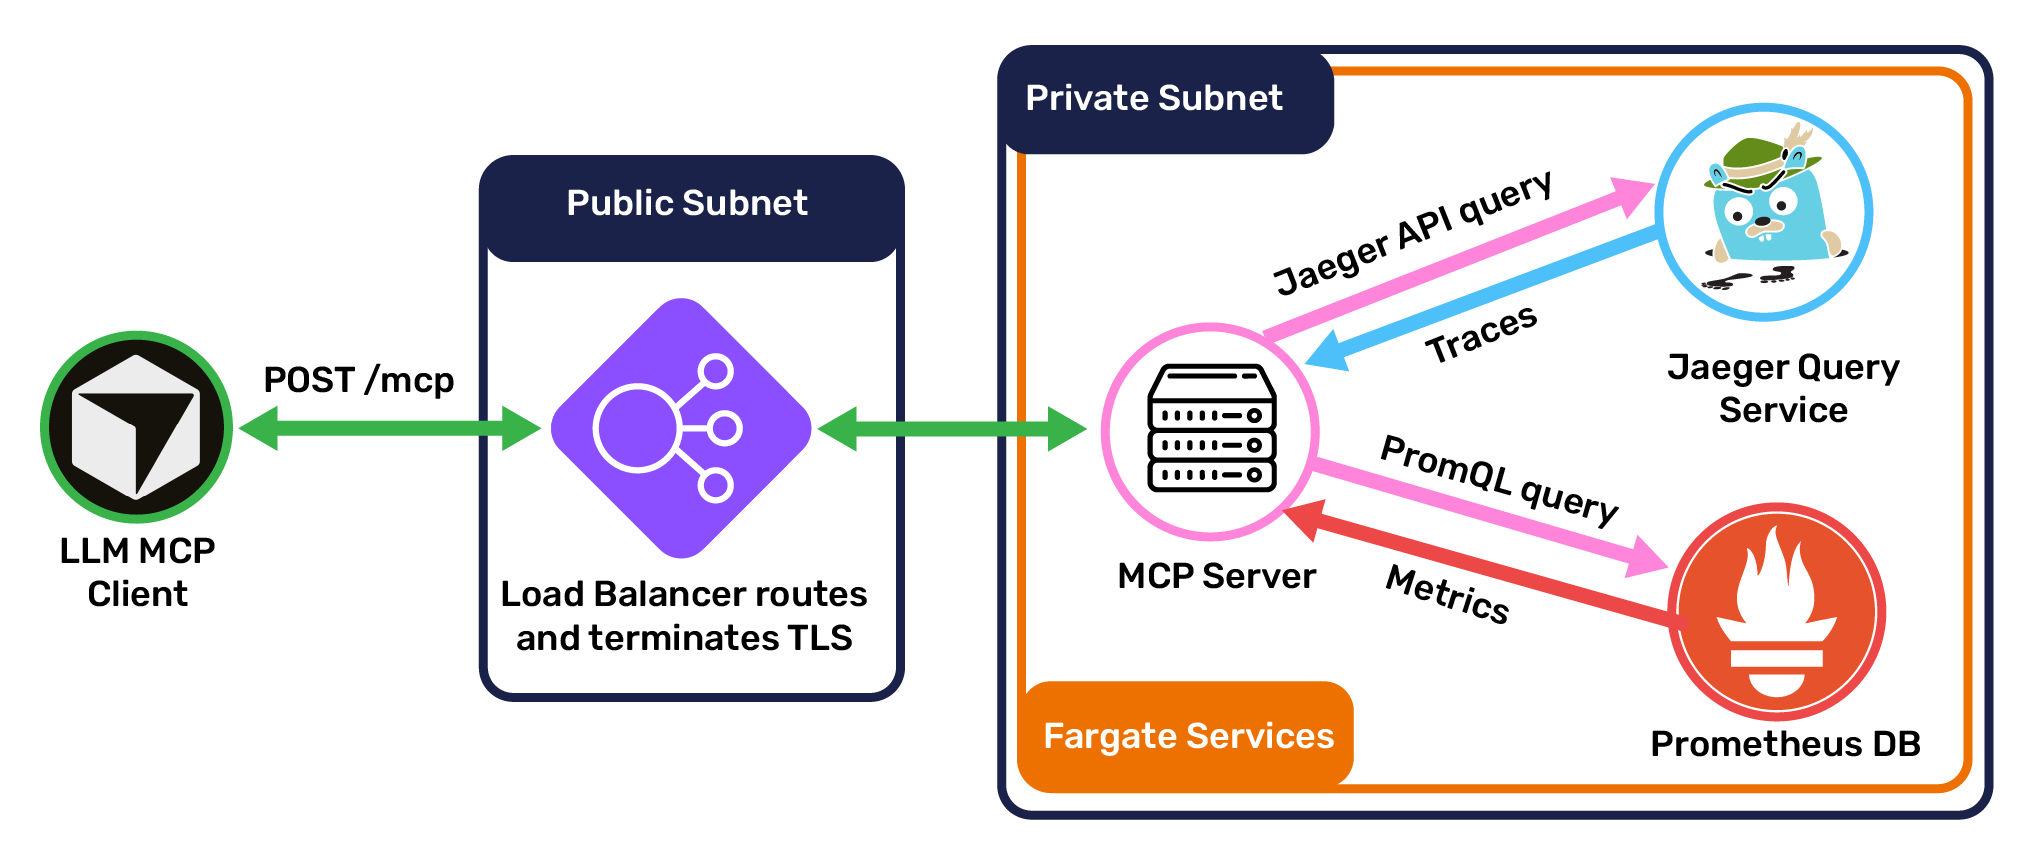
The Retriever MCP server is a TypeScript application using Express and the Model Context Protocol SDK. Because the MCP is designed to run in the cloud, it communicates over StreamableHTTP, the standard protocol for remote client/MCP communication. Clients connect to the MCP through the same load balancer that directs users to the Jaeger UI, with a POST request to the path /mcp.
Once a connection is established, clients can use the server's primary tools: list_services, get_traces, and get_service_health. When a client invokes a tool, the MCP server makes requests to Jaeger Query and Prometheus for trace and metric data, respectively. It then processes this data for compactness and LLM- or human-readability, and sends its result to the client.
6.6 Public Interface
Traffic from outside the network (users and MCP clients) connects to service endpoints via a single load balancer, which handles authentication and routing. Unauthenticated traffic is redirected to an authentication proxy server, where the user can authenticate with a JWT token. Given a valid token, the proxy server sets an authentication cookie for the user and redirects them to their desired service.
7. Future Development
7.1: Enhancing The MCP Server
The current implementation of the Retriever MCP focuses on a small set of powerful tools. While these tools have performed well in testing, we're interested in adding more features to further empower AI agents. New tools may suggest themselves as we continue to work with Retriever, and we're interested in learning what needs our users uncover. The MCP standard also includes other primitives that agents can make use of, such as prompt templates, which offer more opportunities to improve LLM performance. Additionally, MCP is guiding development of MCP servers toward the use of code execution, in which an agent can use an internal coding sandbox to execute code before adding context to the window that is sent back to the model. Our server currently returns both the plain text `content` as well as the code-execution-friendly response format `structured_response` so that it can easily integrate in the future with agents who have code execution enabled.
We may be able to gain even better performance by changing the way our MCP shares data. TOON (Token-Oriented Object Notation) is a JSON replacement designed for more efficient LLM token usage (by around 25%, and potentially more). As we continue to work on distilling telemetry data for LLM use, TOON adoption is a natural fit.
7.2: Observing the Observability System
What happens when Retriever goes down? We'd like to offer Retriever-caliber observability of Retriever itself. It's tempting to run a second deployment of Retriever to monitor the first, but there's a clear downside: any problems present in the primary deployment would be present in the secondary. If a bug takes down the main Retriever service, it's likely to take down the secondary right when users need it most. A more resilient option would be to instrument Retriever to pass telemetry data to AWS-managed services like CloudWatch and X Ray.
7.3: Integrating the MCP and UI
The Retriever UI and MCP are each useful, but they're isolated from one another. It's natural for them to start communicating, so that human users and AI agents can easily share and discuss the same data. Imagine these workflows:
- As you browse the Jaeger dashboard, you notice an unusual cluster of spans with errors. You type in Cursor, "Analyze what I'm currently looking at in Retriever," and receive an analysis of that data.
- An alert comes in and you ask your agent, "Find groups of requests in the last day with a response time over 300ms and send me a link to that view in Retriever." After a few MCP interactions, the agent returns a link with the view you requested.
While this would require some restructuring of the Retriever architecture, we're interested in the implementation challenge and excited by the possibilities.
Our Team

Benjamin Walker
Software Engineer
Chicago, IL

Philip Knapp
Software Engineer
Chicago, IL

Zane Lee
Software Engineer
Charleston, SC

Ryan Foley
Software Engineer
Hartford, CT